stream_temperature
stream_temperature.Rmd
library(fishguts)Intro
This is a workflow to get stream temperature data within our domain. We’ll use the {fishguts} package to call the NorWeST stream temperature scenario endpoints. NorWeST stream temperature scenario maps were developed at a 1-kilometer resolution using spatial statistical stream network models. Stream temperature data used to fit the temperature model that created the scenario maps were screened using a consistent set of criteria to ensure the use of accurate temperature measurements.
Application of these techniques in previous research has yielded accurate and unbiased stream temperature models and predictions (R2 ~ 0.90; RMSE < 1.0 ˚C; for more details, click here). Multiple historical scenarios from 1993 to 2015 (Figure @ref(fig:figure-1)) are available, as are future scenarios for mid-century (2030–2059), end-of-century (2070–2099), and date agnostic temperature increases (e.g., +1C relative to historical baseline periods). The stream temperature scenarios can be downloaded as geospatial data, which enables the display and querying of stream temperatures for river basins and other areas of interest across the western U.S.
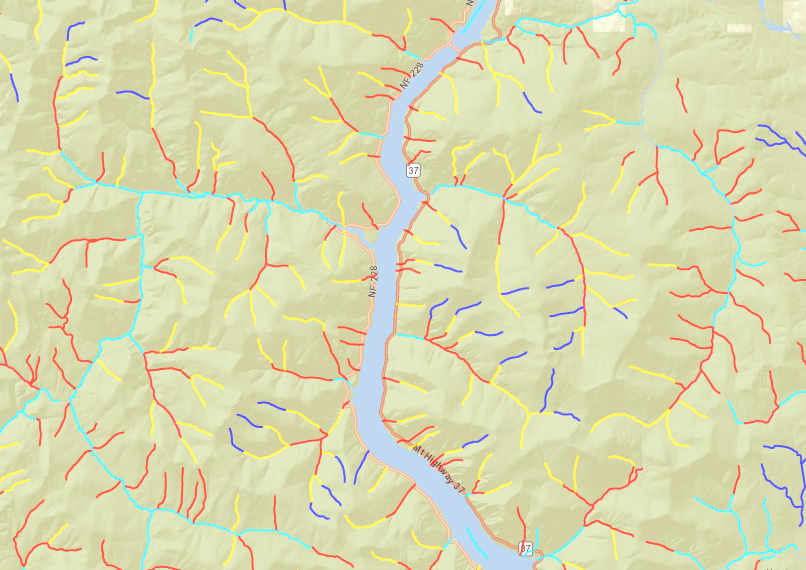
NorWeST stream temperature showing current 1993 to 2015 dataset in Norwest Montana
Getting the data
There are different regions that we can grab from NorWeST data called
processing_units (Figure @ref(fig:figure-2)). In addition,
there are two different features we can grab from the endpoints: points
and lines.
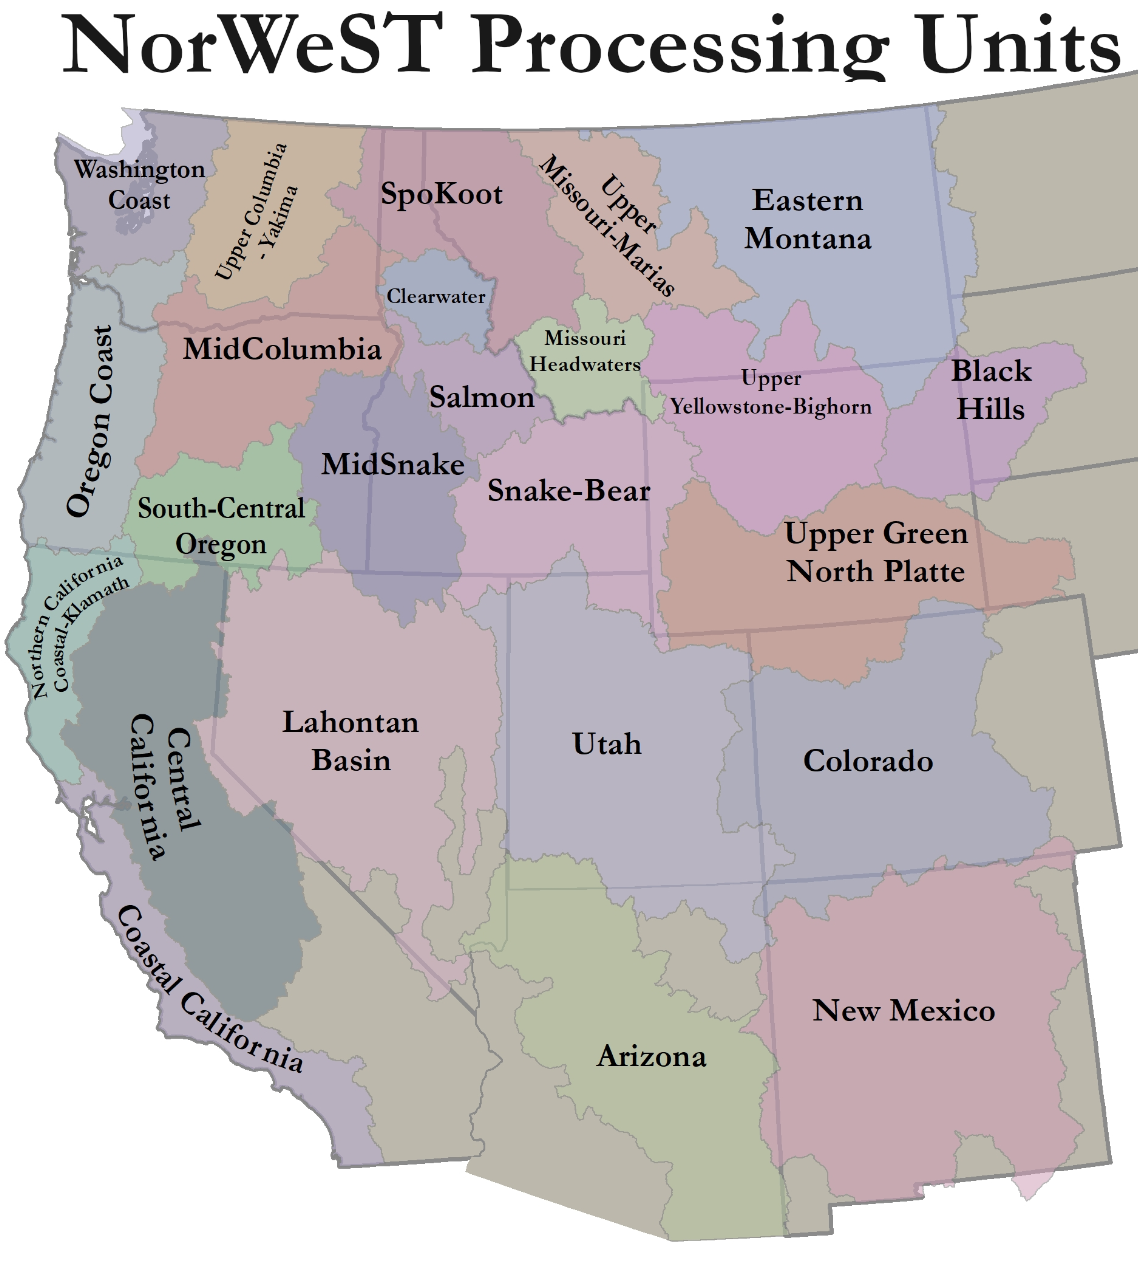
Map showing the different processing units avaiable
Let’s grab the SpoKoot data for both lines and points
since this is the only area we’ll need.
library(sf)
library(tidyverse)

#lines
spokoot_lines <- get_NorWestStreams(processing_units = 'SpoKoot', type = 'lines') %>% st_as_sf()

#points
spokoot_points <- get_NorWestStreams(processing_units = 'SpoKoot', type = 'points') %>% st_as_sf()